

Advancing resilience intelligence: bridging physical risk and corporate adaptation

As climate-related disruptions intensify, decision-makers need better ways to understand not only where physical risks exist, but also how organisations are preparing for them. Earth Capital Nexus, with XDI (Cross Dependency Initiative) and Arc, has developed a new framework that connects asset-level physical climate risk data with steps corporates have taken to build resilience. This framework has now been launched on ResilienceArc, a new open platform designed to help investors, businesses, policymakers and researchers better assess resilience to climate-related physical risks. In this commentary, we provide some early insights from the framework.
ResilienceArc is designed to bring coherence and clarity to a fragmented information landscape on resilience. Firstly, it provides a comprehensive view of how climate-driven hazards are impacting companies directly through corporate assets (such as factories, infrastructure, and other physical installations) and indirectly through infrastructure, supply-chains and the economy. Secondly, it assesses the extent to which company reporting is capturing processes and actions that will build long-term resilience.
ResilienceArc features around 200 companies across five metrics. Four metrics assessing relevant disclosure (Processes; Implementation; Governance and Targets) are intersected with asset-level analysis (Assets). A further 2,800 companies have asset-level analysis only, covering financial impacts from damage and revenue impairment.
Early insights
1. Signals on resilience are beginning to emerge
In the beta release of ResilienceArc, the approximately 200 companies with both asset and reporting analysis receive low overall grades. This reflects their exposure to physical risk at the asset level as well as the current state of adaptation planning and action – at least in terms of what companies currently disclose. This distribution is clearly visible in the data – see Figure 1.
Figure 1. Distribution of ResilienceArc metric scores
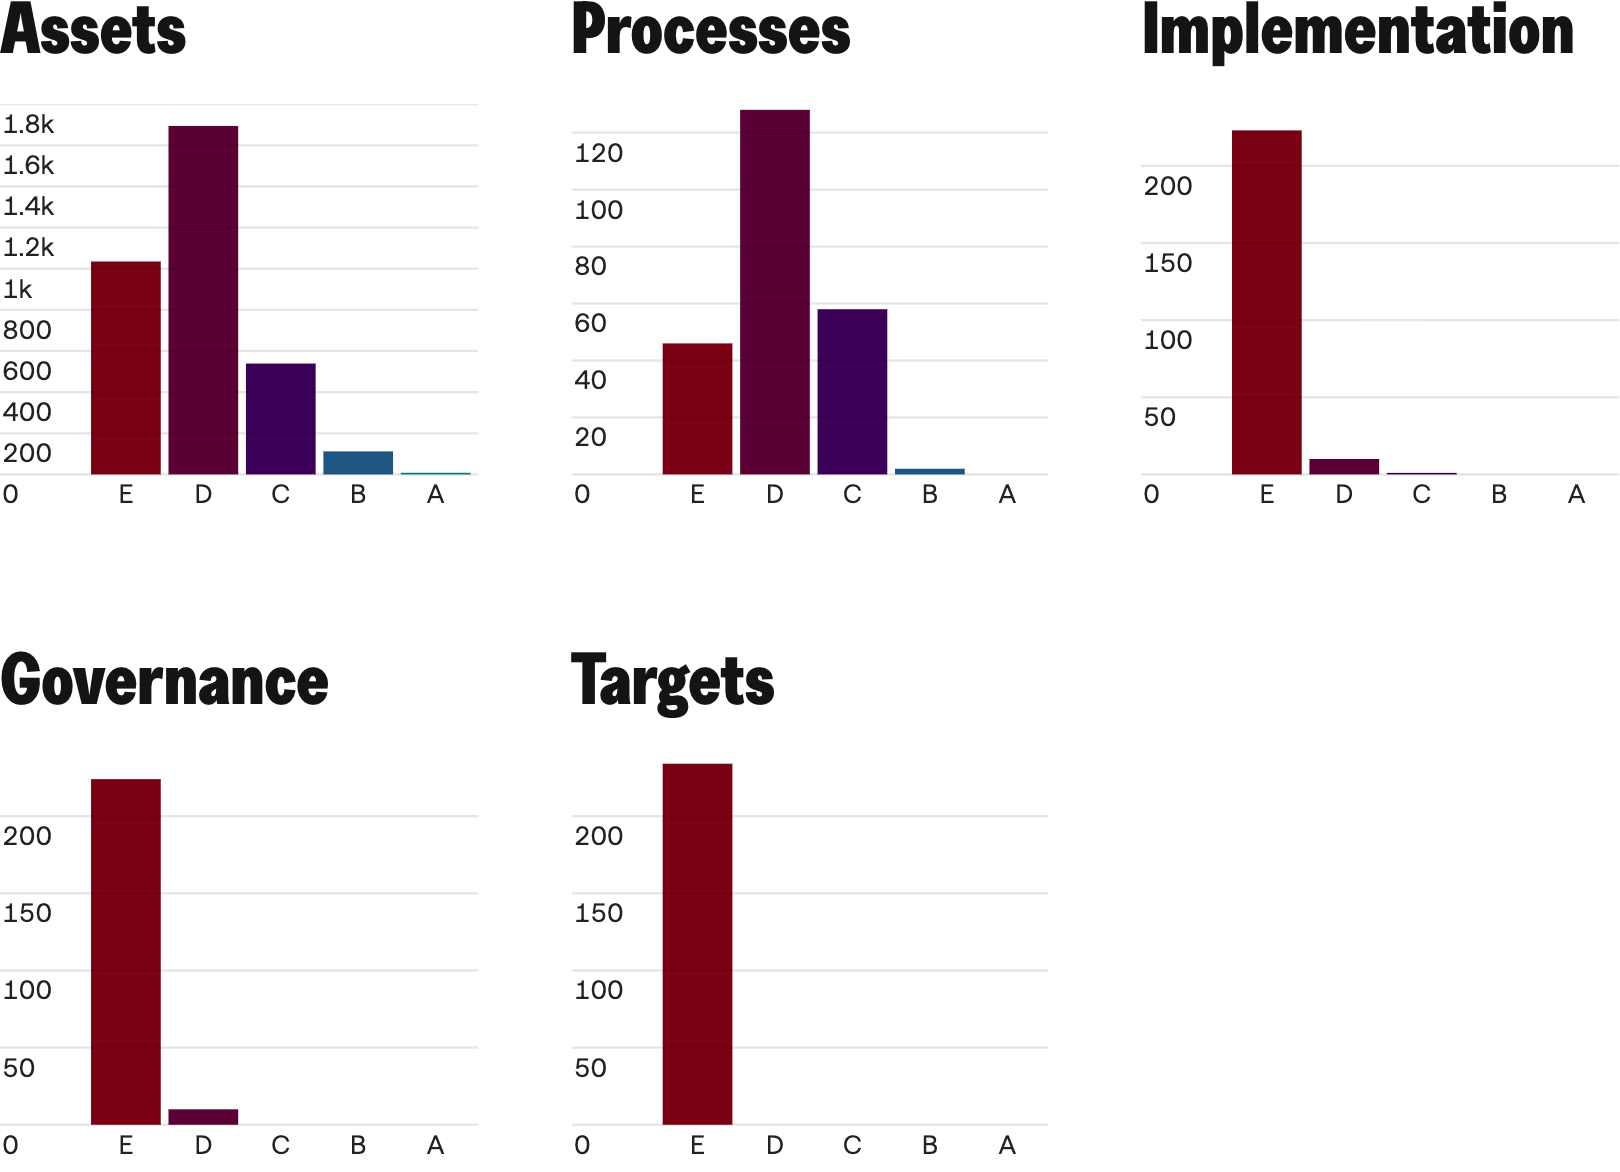
Further trends emerge when digging deeper into the data. In the Governance metric, for instance, most companies receive a low grade overall, but 80% of companies assessed have identified either a board member or C-suite executive as responsible for climate- and nature-related risks. 9 in 10 companies assessed receive a C or above for at least one sub-metric in ResilienceArc. The five metrics are underpinned by 14 sub-metrics and over 200 indicators.
Companies score highest on the Processes metric – assessing the completeness of corporate risk and impact assessments, and the consistency of integration of this into operations and strategy. Over 90% of companies in the sample conduct either risk or environmental impact assessments across their business units and operations. Three quarters are demonstrating best practice by including their value chain within this assessment.
2. Higher exposure is not driving greater disclosure on resilience
Across the board, it is hard to determine whether corporate business strategies are fully factoring in the risks of climate impacts. While around a quarter (28%) of companies have an adaptation plan with either partial or no costing, no companies publish a fully costed plan. The average capital investment into adaptation and nature-related solutions sits at around 3% with only 40% of companies investing in either category.1
Limited disclosure or evidence of action is particularly concerning for companies with greater exposure to physical climate hazards. Among the companies assessed, those with high exposure are no more likely to set out how they assess, prepare and plan for the occurrence of hazardous climate events than companies with lower exposure.
Figure 2. Assets metric scores (x-axis) vs. Disclosure-driven metric scores (y-axis)
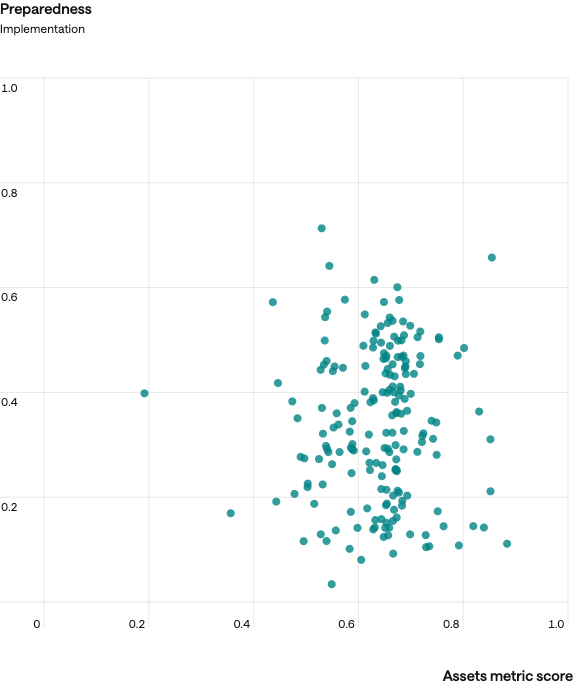
Note: Disclosure-driven metric scores represented in this graph are the average score across three metrics: Processes, Implementation and Governance.
Few companies have robust forward-looking commitments on climate resilience. Only five of the companies assessed by EarthCap have disclosed hazard-specific resilience targets. Extreme heat is a significant hazard2 for all companies included in this assessment, but only one has a target for managing it. No company has a target for surface water flooding, a significant hazard for nine in 10 companies. This means investors and regulators are at a loss in understanding companies’ appetite to tolerate, address or transfer heat-related risks, for example.
Figure 3. Share of companies setting targets for hazard management
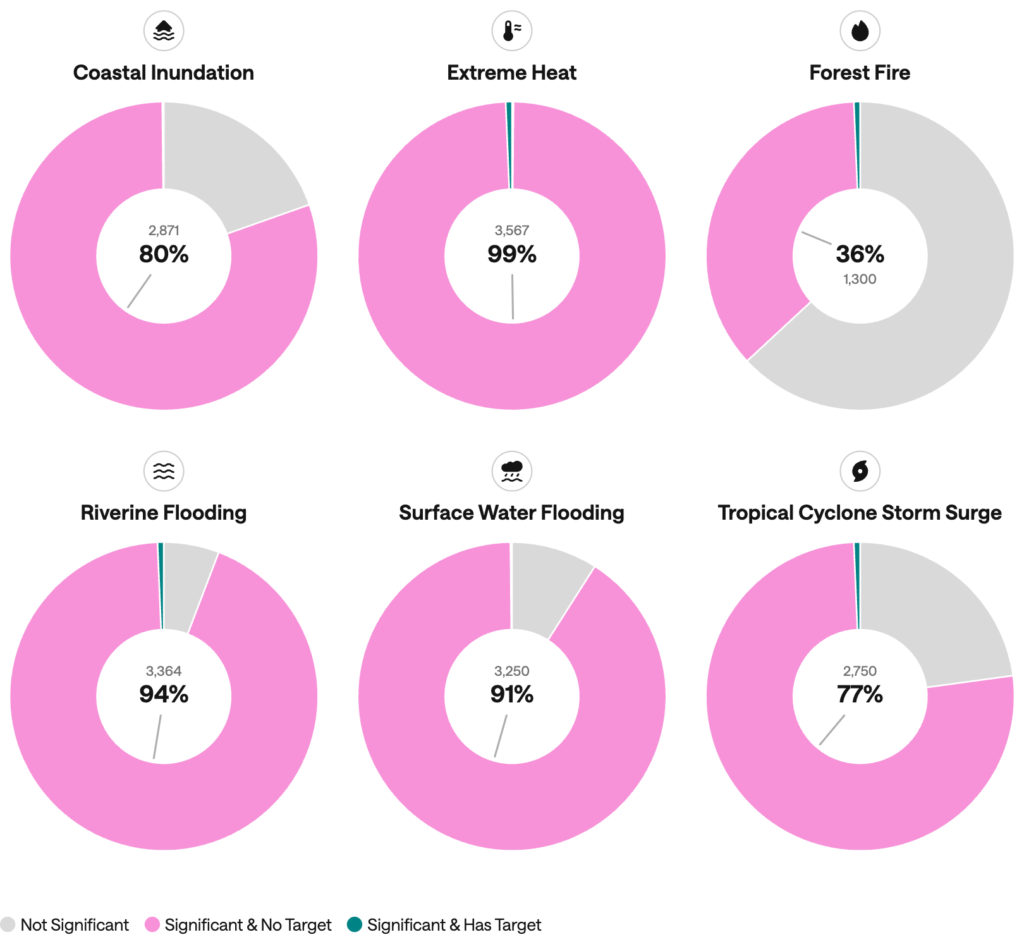
However, a third (68) of companies have set impact-based targets which address significant direct drivers of environmental harm. The drivers are selected using a sector-level mapping based on ENCORE.3
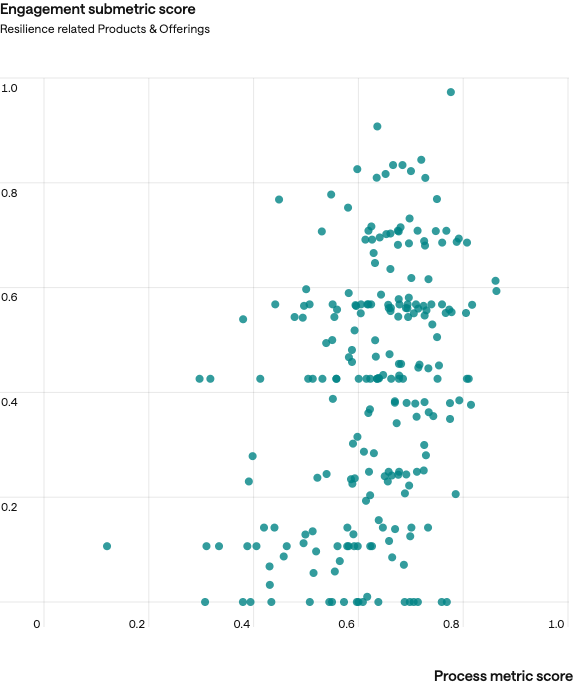
There are some signs that companies are taking the step from assessing risk to action on climate risk. Those with robust risk processes tend to disclose larger financial commitments to resilience and have more product offerings that contribute to resilience.4
Figure 4. Processes metric score (x-axis) vs. ‘Products & offering’ sub-metric score (y-axis)
3. Widespread exposure to risk at the asset level
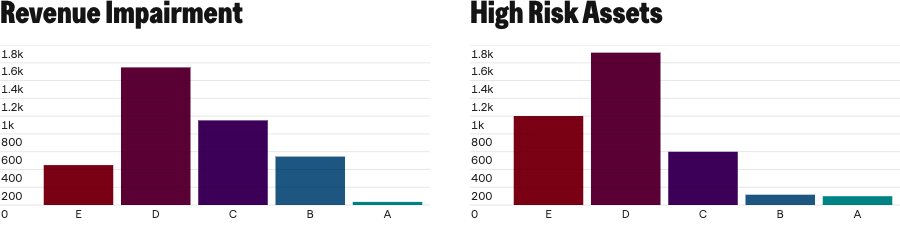
In ResilienceArc, the assessment of physical risk spans 3,000 companies and 2 million assets. It considers revenue impairment as well as the proportion of high-risk assets for each company. Overall, nearly all (96%) companies are associated with high-risk assets.
Figure 5. Score distributions for assets sub-metrics, ‘Revenue Impairment’ and ‘High Risk Assets’
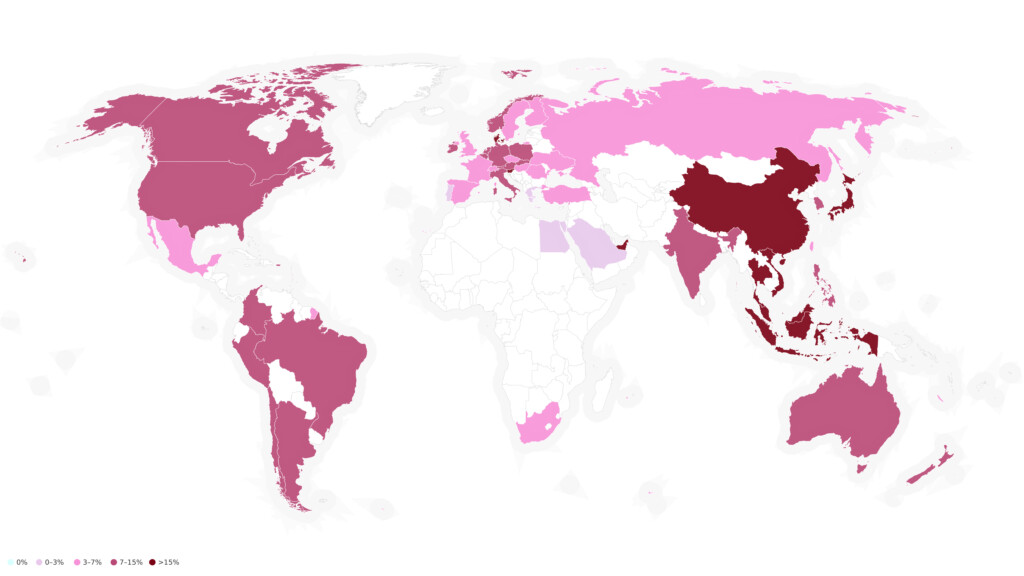
While there are high-risk assets in all geographies, they concentrate in certain regions. For instance, there is a larger share of high-risk assets in some Asian countries.
Figure 6. Percentage of assets that are high risk by country (only countries with over 1,000 assets)
4. Supply chain risk is a key vulnerability
The assessment includes direct impacts, such as an outage at a facility, and indirect impacts from disruption to supply chains, surrounding infrastructure and the wider regional economy. For 60% of companies, considering the supply chain increases risk by at least half, compared with direct impact alone.
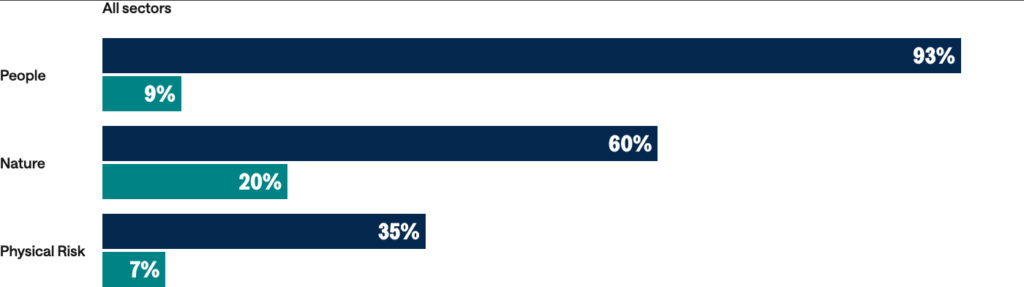
Of the approximately 200 companies with all five metrics assessed, one third (34%) describe how they engage upstream with suppliers on physical risk, while less than 10% provide examples of engagement downstream. Social issues receive well-deserved attention, with 92% of companies providing examples of upstream engagement.
The Food & Agriculture sector stands out for providing examples of upstream engagement on nature-related issues (90% versus 60% across all sectors). Companies that engage partners on social or climate issues are also more likely to disclose nature-related engagement, suggesting that companies are taking an increasingly integrated approach.
Figure 7. Percentage of companies that disclose how they are engaging with their value chain, by engagement topic
The road ahead
The results presented here are preliminary and we expect new trends to emerge as company coverage grows, the methodology is refined and corporate adaptation planning matures.
ResilienceArc brings together asset-level analysis with corporate disclosure. Asset-level analysis provides a rich picture of exposure to physical risk – both direct and indirect – but signals can be missed when comparing companies with similar profiles. Assessment of disclosure gives insight across a range of indicators but lacks transparency and validation without geographical context. In combination, they can provide decision-useful information on corporate resilience to investors and regulators.
Enhanced disclosure is needed to fully assess how companies are building resilience to physical risks into their business planning. More will be available soon, starting with jurisdictions committed to introducing disclosure requirements in full alignment with the International Sustainability Standards Board5 – including the climate specific standard (S2) which covers vulnerabilities to physical risk.
ResilienceArc is in beta and is built to evolve. Companies named are invited to review their results and engage with the team if they have asset or reporting insights that may have been missed. We will continue to work with partners across the resilience ecosystem to refine methodologies, develop crosswalks between datasets and frameworks, integrate new data sources, and validate findings against real-world experience.
Working with companies, investors, data providers, academics and scientists, risk experts, and policymakers, we hope to continuously strengthen our collective understanding of what drives resilience in practice. Our ambition is to build a living intelligence layer for resilience – one that becomes more accurate and more decision-relevant over time.
Learn more about the collaboration. A version of this commentary was first published by Arc on 19 June 2026.
Felix Preston is Director of Research & Program at Arc.
Karl Mallon is the Co-founder and CEO of XDI.
Rachel Hawker is Head of Research at Arc.
Sarah Caroll is a Senior Associate at Arc.
Emily Harrison is a Research Associate at Arc.
1. Based on a mapping of adaptation and nature-related solutions against the Corporate Knights Sustainable Economy Taxonomy by LSE EarthCap, and using Corporate Knight’s Sustainable Economy Intelligence dataset. Taxonomies for adaptation and resilience are evolving so these figures are likely to be adjusted in future.
2. According to ResilienceArc’s methodology for determining hazard significance. See the methodology on ResilienceArc for details.
3. See ENCORE website: https://encorenature.org/en.
4. Companies scoring above average in the Processes metric slightly outperform on making resilience-building investments, resilience-related products and offerings, or engagement with resilience related issues.
5. See IFRS Foundation, Jurisdictional profiles: progress towards adoption of ISSB Standards, June 2025. Available at: https://www.ifrs.org/news-and-events/news/2025/06/ifrs-foundation-publishes-jurisdictional-profiles-issb-standards/.
Related insights